
A scrollable day-strip date slicer built for operational timelines. Kinetic Timeline filters your Power BI report by date — and by time of day — and pairs with Kinetic Map to step an entire operational picture through time.
Download the latest release
View pricing
Support & documentation
See it in action
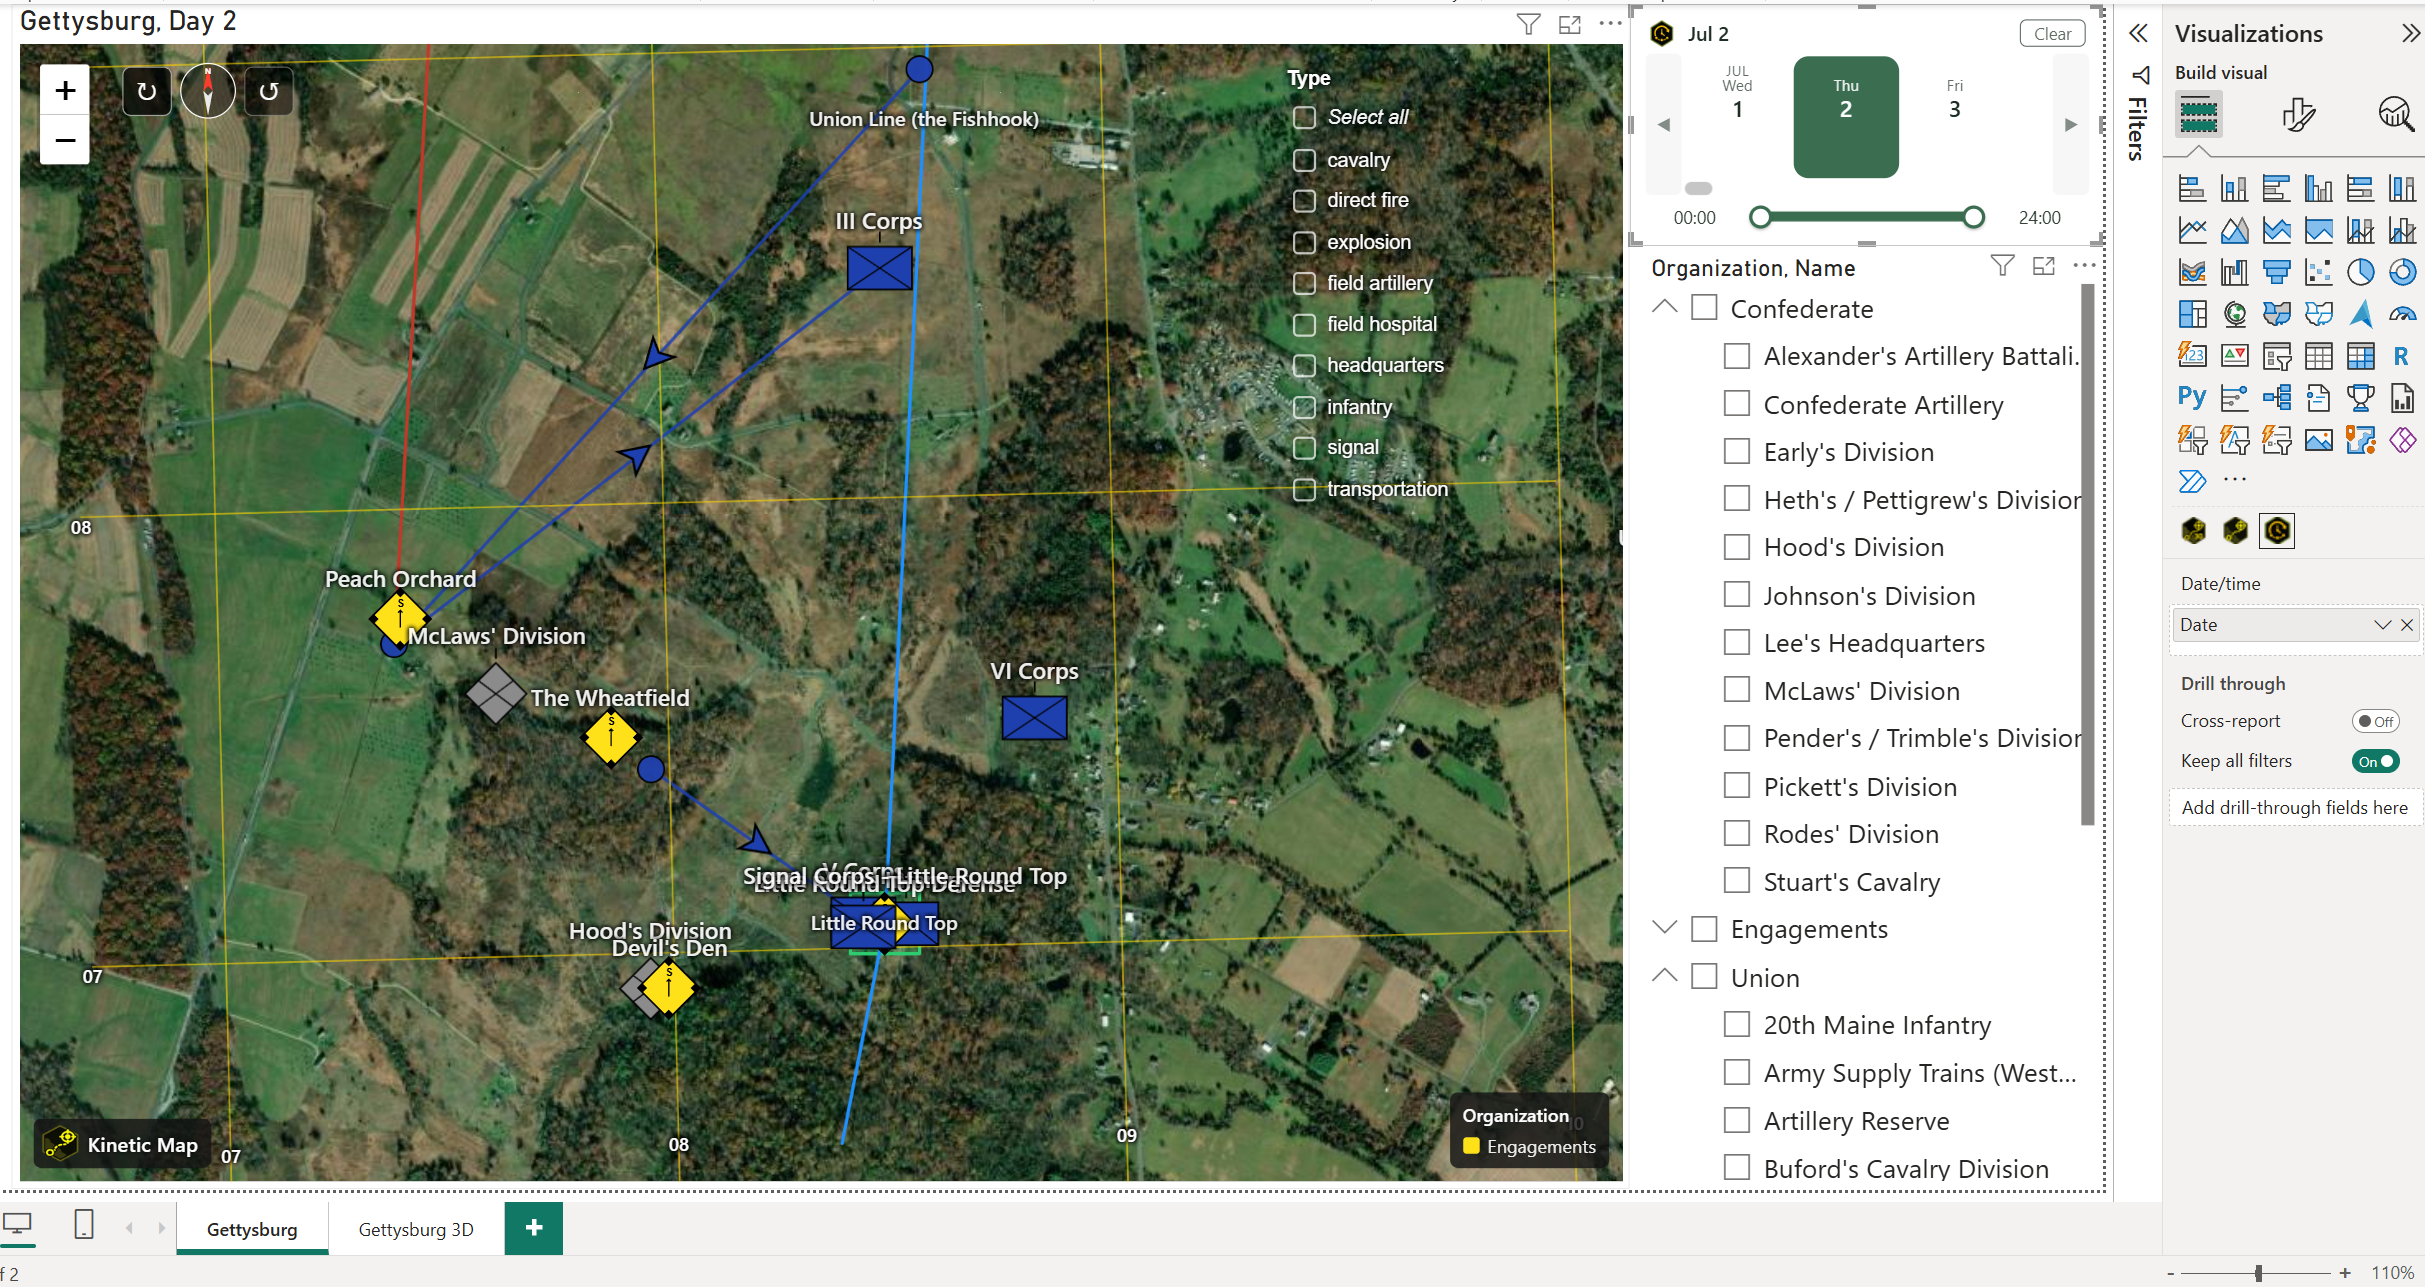
In the included Gettysburg sample, the day strip at the top of the report drives the entire map — selecting July 2 filters every unit and engagement to the second day of the battle, and the time-of-day slider scopes events down to the hour.
Key features
- Day-strip date selection — scroll to any date and ctrl + click or click-drag to select a single day or a contiguous range.
- Within-day time filter — drag a time-of-day slider to scope fast-moving events down to the hour inside a single day.
- Historical-date support — handles dates earlier than standardized time zones, so you can faithfully recreate historical events (the 1863 Gettysburg sample relies on this).
- Customizable coloring — many pre-made color schemes plus custom color overrides.
- Page-wide sync — emits a standard Power BI filter that scopes every visual on the page, including both Kinetic maps.
Get started
Download Kinetic Timeline and open the Gettysburg sample report — the .pbix and its raw .xlsx dataset, or read the full documentation and field reference. The day strip, multi-day selection, and standard date filtering are free — subscribe to unlock the within-day time filter and the full set of color schemes.